Comparing the Scoring Patterns in the EPL with the ‘A’ League
I find it interesting to compare scoring patterns in different competitions and also to look at the way the top teams score goals compared with the pattern of all teams in the competition.
Scoring Categories
I created three categories of goals in Open Play to include ‘Crosses’ from outside the penalty area and within 18 meters of the goal line, ‘Other Methods’ (OM) for goals where defenders may be goal side of the ball and a category for goals resulting from passing the ball behind the defence (BB) or to a player almost level with the last line of defence. Goals scored as a result of a player dribbling past the last line of defence are included in the ‘Other Methods’ category.
Results
In Figure 1, the comparison between the EPL and the ‘A’ League shows a similar pattern with 44% from the ball behind category, 39% and 42% in ‘Other Methods’ and 17% and 14% from ‘Crosses’.
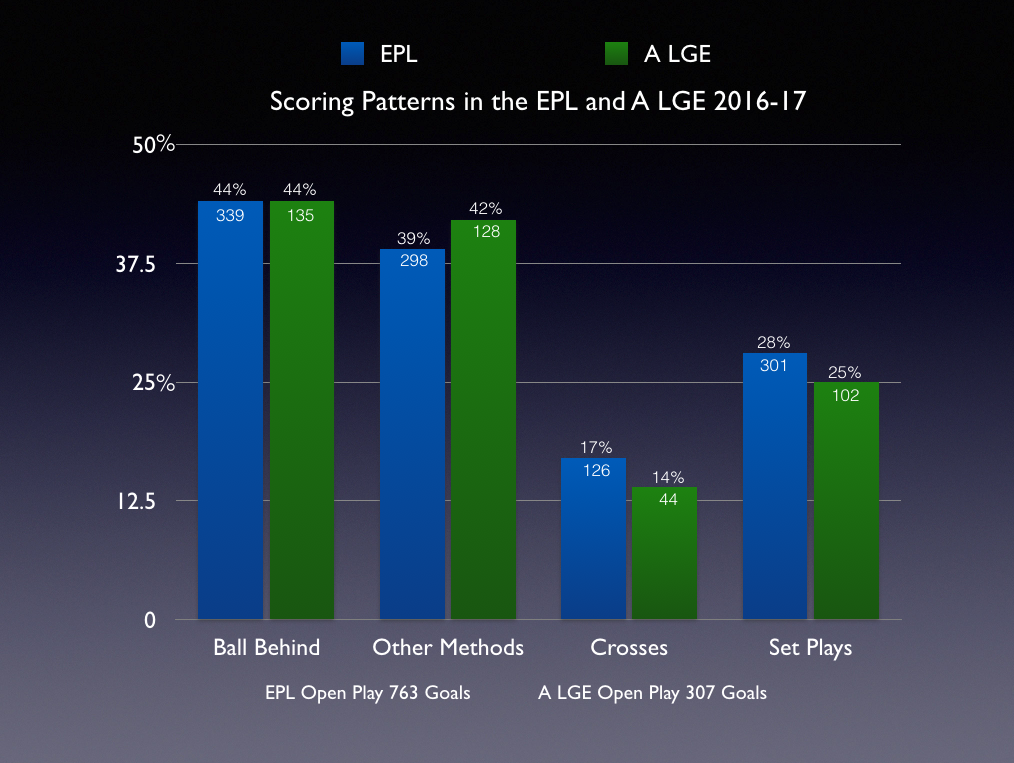
Figure 1 – EPL and ‘A’ League Categories of Goals
The Top 3 EPL Teams
Analysis of the top three teams in each competition shows Chelsea with 58% of goals from ‘Other Methods’ and 34% from playing the ball behind, while Tottenham and Man City scored the majority of their goals from playing the ball behind, 42% and 55% with goals from Other Methods at 35% and 31% respectively. Chelsea , Tottenham and Man City scored 8%, 23% and 14% from Crosses. See Figure 2.
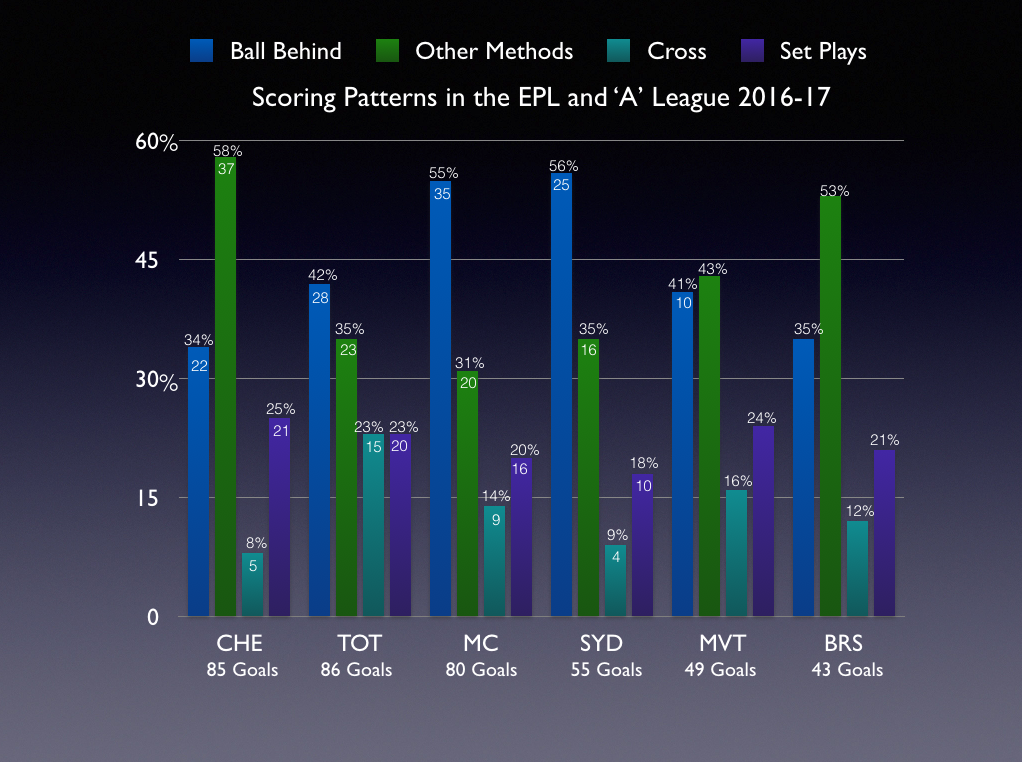
Figure 2 – Top three teams and categories of goals
Why would there be such a difference in scoring patterns you might ask? It helps to know something about the players in each team. For example Chelsea had Eden Hazard, Pedro, Willian and Diego Costa who all like to receive the ball to feet and dribble. Goals from dribbling are allocated to the ‘Other Methods’ category so it’s not surprising that Chelsea had the highest percentage in that category. Hazard scored 8 goals and set up 3 more as a result of dribbling, which is 11 out of a total of 37 goals; 30% from one player.
Tottenham and Man City both have players who can dribble but they also have players who like to make runs in behind; Kane and Deli Alli at Tottenham, Aguero and Jesus at Man City and both teams are very good at counter attacking.
The Top 3 ‘A’ League Teams
Sydney FC set numerous records last year and in doing so they scored 56% of their goals (25) from playing the ball behind the opposition or to a player level with the last line of defence who could go forwards with the ball. Melbourne Victory scored 43% from ‘Other Methods’ (16) and 41% from playing the ball behind, whereas Brisbane scored 53% from ‘Other Methods’ (18) and 35% from playing the ball behind (12).
Sydney, Melbourne and Brisbane scored 10,12 and 9 goals respectively from Set Plays.
Goals and Number of Passes
Many people think that playing a possession-based style of football will be reflected in the number of goals scored from longer passing sequences. The reality is that more goals are scored from quick transitions from defence to attack, regardless of where possession is regained and the style of football played. On that note I think it is naïve to think that football is played one way or another, i.e. possession-based or direct play. Figure 3 shows the ‘confirmed’ number of goals in Open Play and the percentage of goals that were scored with 5 passes or less or 6 passes or more.
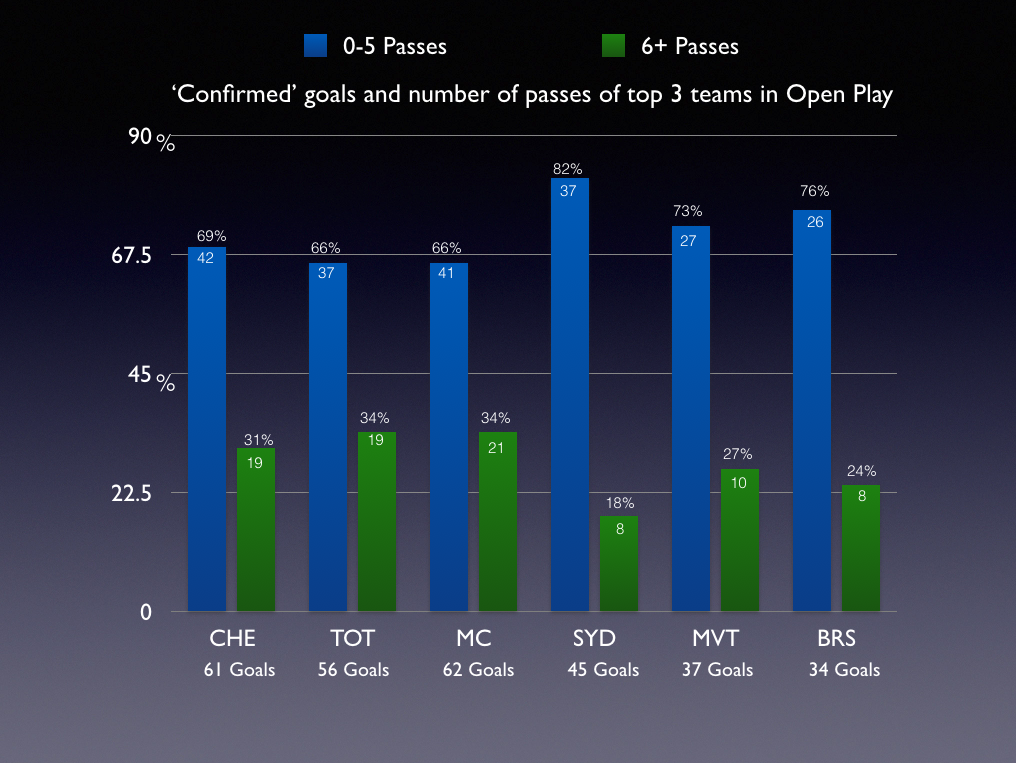
Figure 3. Top 3 Teams and number of passes for goals in Open Play
The three teams in the ‘A’ League scored between 73% and 82% from 5 passes or less compared with the top three teams in the EPL who scored between 66% and 69%. Interestingly, Sydney FC, who won the ‘A’ League scored the highest number of goals from 5 passes or less with 37 out of 45. This figure is also very high because they scored 32 of their 45 goals in Open Play from regained possessions in the opponent’s half of the field and reinforces my earlier comment about the importance of speed in transition in attack.
Conclusions
The figures show trends in scoring patterns across competitions. For example in ‘Leagues’ the trend is for the majority of goals in Open Play to be scored from passing the ball behind the opposition followed by goals from ‘Other Methods’, but only by a small margin, with the lowest number of goals from ‘Crosses’. The majority of goals by a considerable margin are usually scored with fewer rather than more passes.
Some teams ‘buck the trend’ in the way they score goals compared with the overall trend in the competition and that is usually a result of the type of players they have in the team, e.g. Chelsea had a high number of players who like to dribble, which would have contributed to the team scoring more goals from ‘Other Methods’.
At this stage of the 2017-18 season it would be interesting to see if Chelsea are scoring goals in a similar fashion to last season. They no longer have Diego Costa and Eden Hazard has been used more as a central striker, making more forward runs than he did last season where he usually played from a deeper position. It would also be interesting to see if Sydney FC are scoring as many goals from fewer passes and from regained possessions in the opposition’s half of the field.